Harnessing the Power of Visual Information: 5 Key Steps to a Powerful Infographic
No Comment Aug 20, 2020
The competition for attention in the World Wide Web has led to the development of revolutionary methods to present content. With the high volume of data entering the internet sphere every minute, the challenge to entice the audience towards content appreciation becomes harder over time. Full text content were deemed unsuccessful at getting readers hooked, and so audio and visual content types were used, and have proven to be effective.
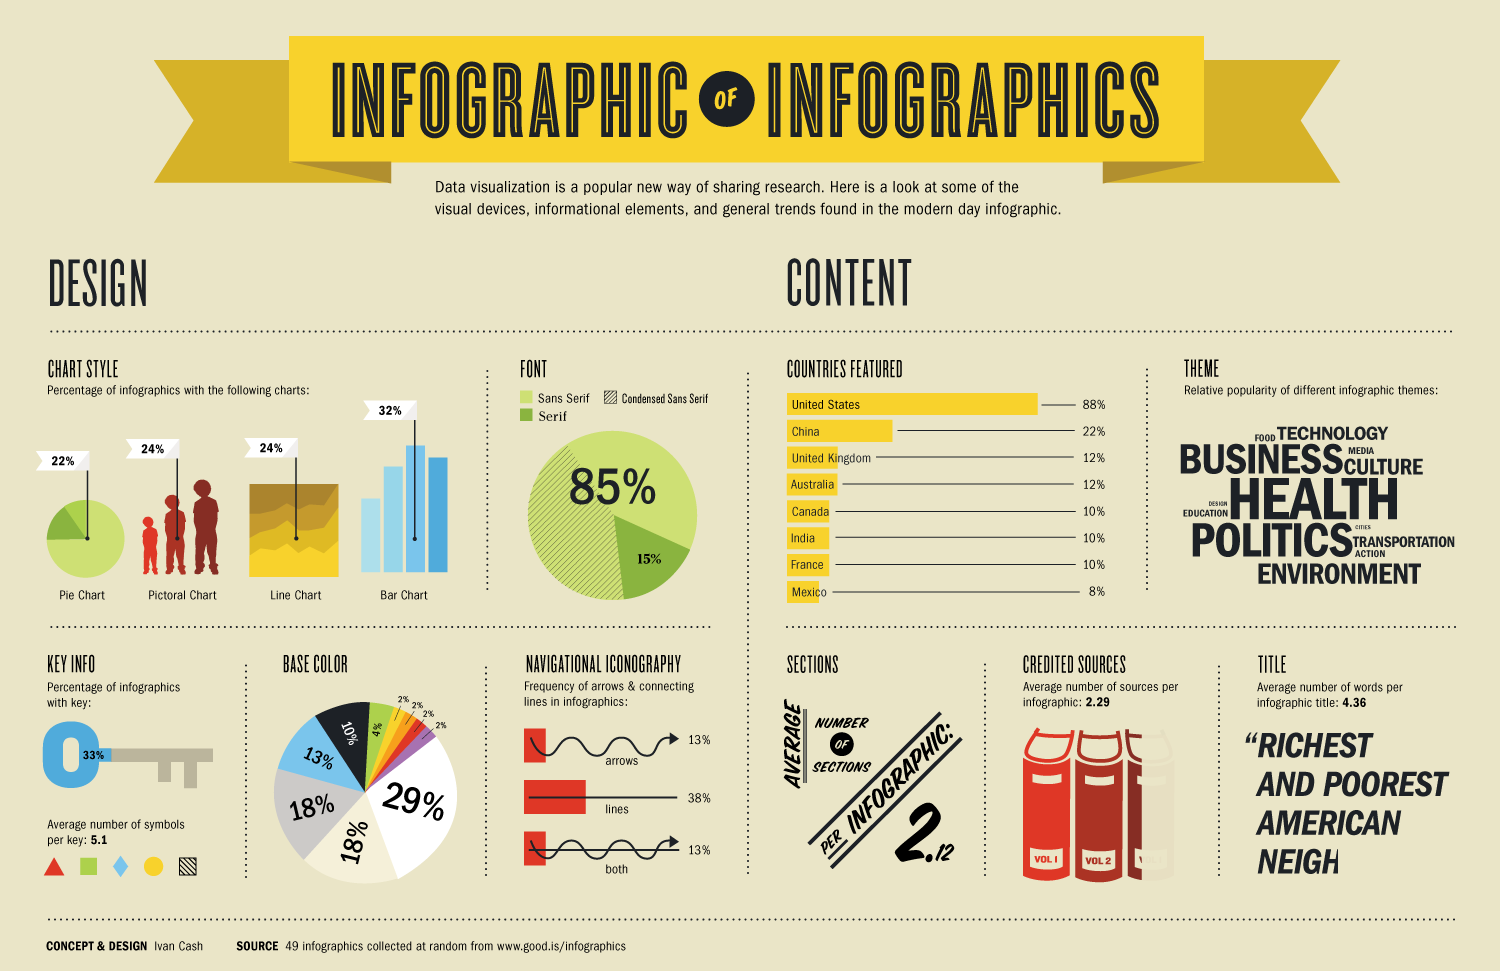
With the demand for compelling images on the web combined with people’s lower retention of heavy data consumption, comes an innovative method for content presentation which combines the power of images and substantial, easy-to-digest information—known today as the Infographic.
Over time, infographics have proven to be sensational due to their unconventional methodology to present information. It has been used by a lot of marketers and cyber personalities as a captivating alternative to help people digest information easily. However, due to its nature and purpose, creating an infographic can be a big challenge. Presenting substantial data by using less text, depending on how it was crafted, can be as much a failure as effective.
So, how do you make an effective and powerful infographic? Here’s how:
Step 1: Know and Understand Your Audience
The first step is to determine who your audience is. You need to be able to tailor your infographic towards a specific target audience. Find out what appeals to them, what captures their attention, and what makes them tick. Also learn how they digest content, what designs and colors call their attention, and what topics have the highest tendency to be appreciated and consumed. Knowing what to offer to whom will give you the right head start towards creating a powerful infographic.
Step 2: Decide on What Story to Tell
The effectiveness of an infographic heavily relies on the quality, relevance and significance of the information you will provide. Tell a story that your audience needs and wants. Break down broad topics into specific ones to make it as substantial as possible. You have to be very clear on what issues or challenges that it addresses. Like text content, your infographic should have a distinct beginning, middle and end.
Step 3: Filter Information
The main purpose of an infographic is to offer quick, yet substantial information. One can’t just decide to put things in there or crowd it with just anything and everything. You need to be able to decide which information deserves to be included and what needs to be removed. Determine which data supports your whole story sufficiently and what can be just set aside. This needs extensive research and analysis of the data. The simpler you can present it without leaving out important information, the better.
Step 4: Organize Your Data
With all important data to be included on hand, the next step is to organize the data properly to intensify its power. Outline your content in a way that will have an indulging beginning, with well-organized supporting information in the middle and a clear conclusion at the end. Decide on an interesting or intriguing headline and put the most powerful information on top so the reader can be hooked immediately. Your supporting data should keep the pace and build up momentum towards a definite and distinct ending that leaves readers satisfied with the information.
Step 5: Design Smartly
This is the most painstaking part of the process as it involves a lot of consideration– design, color, and overall presentation. Here, you need to go beyond the traditional. Refrain from using boring bars and graphs and be creative instead. Use symbols or images that relate to the information you are providing. In terms of colors, avoid using a white background as many websites use this color as a background which makes it hard for people to distinguish where your infographic starts and ends. Avoid using colors with contrasting effects which are not easy on the eyes, stick to a maximum of three color palettes that complement each other. Finally, keep it clean and simple.
By following these steps carefully, you are on the right path to creating an infographic powerful enough to go viral.


